Inhaltsverzeichnis
Debugging
There are several ways to test the correct functioning of a mapping transformation:
- In the Mapping Designer:
- In the message basket:
- Starting from an existing and analyzed message4)
1st source object instantiate in the mapping designer
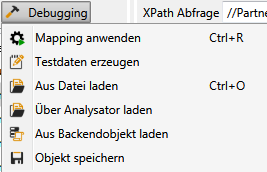
To use debugging in the Mapping Designer, the source object must first be instantiated. Choose  in the upper left area of the mapping definition view. Debugging Menu.

This offers four different options for object instantiation.
a) Create object instance with generated test data
In the mapping definition view, select  in the upper left area. Debugging Menu
 the entry Generate test data. This automatically generates an object instance in the source object with data element-specific content and three instances per ArrayList item.
Test data can be used to quickly check whether the transformation produces the desired results.
b) Create an object instance from an existing file with a known entity
In the mapping definition view, select  in the upper left area. Debugging Menu the entry
  load from file off. If the file selected in the following file selection dialog contains an entity that fits into the source object, it will be instantiated with the contents of the file.
c) Create object instance from an existing file with several entities via analyzer
This method is useful if source files contain several entities of the source object.
In the mapping definition view, select  in the upper left area. Debugging Menu the entry
  Load via analyzer off. First the desired analyzer is selected and confirmed with OK, with the following file selection dialog the desired file is selected. If the file can be successfully analyzed with the selected analyzer, a list of entities will be offered in the following dialog from which one can now select one and confirm with OK.
 Note: If a message contains several entities, they can be selected with multiple selection and instantiated as source. This makes it possible to make groupings or evaluations and conversions beyond the entity context.
d) Create object instance from a backend object
This method is useful if the data source can be operated via database integration. In the mapping definition view, choose  in the upper left area. Debugging Menu the entry
  Load from BackendObject off.
e) Testing transformation chains
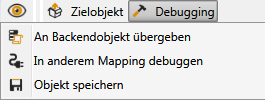
If a target object is successfully instantiated and the system has a mapping with this target type as source type, you can go directly to a new mapping designer instance with the instantiated target. In the mapping definition view in the *right upper area select from the  debugging menu the menu entry
  Debug with other mapping *out.

2. instantiate source object from a message
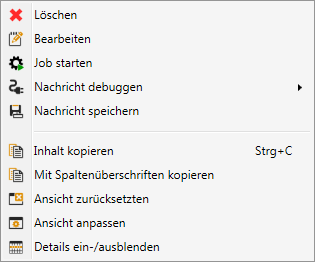
You can access the debugging of mappings directly from messages. So if a message is selected in the list of messages you can use the context menu
via  Debug message * ►
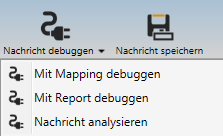
  debug mapping or in the detail view of a message via the menu
the content of the message as source object of a mapping with the menu entry  debug mapping * instantiate.
 Note: Only if the message has already been successfully analyzed. Otherwise
3. Apply mapping
Once you have instantiated the source object, you can translate to the target by removing the following from  debugging menu the first menu entry
  Apply mapping5). The input values are then output in the source object (left side) and the output values in the target object (right side).
Status bar
The status bar6) gives a first feedback about success or failure of the transformation via coloring.
- It is green for success:

- It's yellow on warnings:

- It is red on error:

All translation steps are displayed in a log window, but this must first be displayed via the  button in the status bar7).
XPath Queries
With the XPath query individual selections can be tested for the source instance.
4. mapping error
If errors occur, the entries of the objects where an error occurred are marked red in the  log window with object name and error description. The error description can then be used to locate and correct incorrect links.
Custom Error Message
If a more complex error output is required, a separate CustomErrorExpression can be defined in the map editor for each mapping rule under element-properties. This must also be a XPath-Expression e.g. :
concat('At position: ', $position,' missing the EAN!')

